
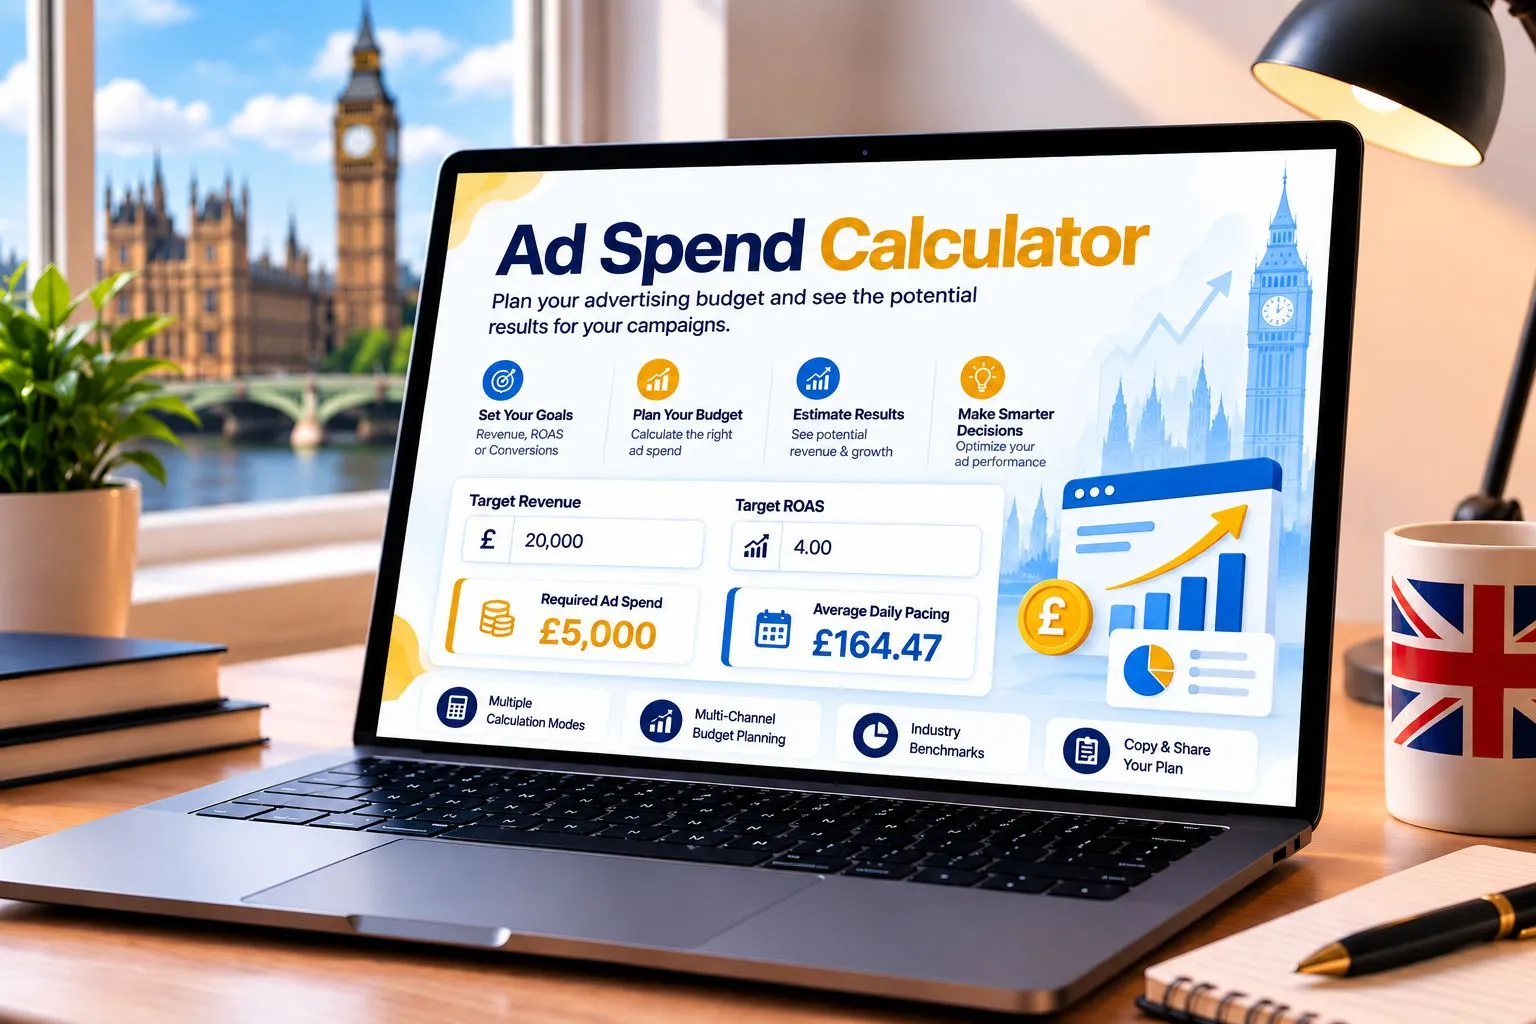
Ad Spend Calculator
Calculate your required advertising budget, forecast spend based on revenue and conversion goals, and plan multi-channel media allocations across Google, Meta, Amazon, and LinkedIn.
£5,000
- Projected ad budget allows disciplined scaling towards your revenue goal.
- Monitor daily pacing and campaign CPA thresholds to prevent mid-month budget exhaustion.
Add KashifDigitals as a Preferred Source
Stay updated with verified paid media budget planning benchmarks, ad spend modeling strategies, and PPC revenue optimization guides.
Was This Ad Spend Calculator Useful?
Your quick feedback helps us enhance the calculator experience and media forecasting tools.
How Ad Spend is Calculated
Calculating ad spend accurately is essential for digital campaign forecasting. Depending on commercial objectives, paid media budgets are derived from target revenue and ROAS, target conversion volumes and CPA, or traffic volumes and average CPC.
Primary Ad Budget Formulas
Formula Examples in Action
- Revenue Target: 20,000 revenue target with 400% (4x) ROAS = 20,000 ÷ 4 = 5,000 required ad spend.
- Conversion Target: 250 sales needed at a 20 CPA threshold = 250 × 20 = 5,000 ad budget.
- Traffic Target: 2,500 clicks at 2.00 CPC = 2,500 × 2.00 = 5,000 ad budget.
- Average Daily Pacing: 5,000 monthly ad budget ÷ 30.4 = 164.47 per day recommended campaign pacing.
Illustrative Ad Spend Benchmarks
Baseline efficiency ratios & target thresholds for budgeting (Source: Illustrative Reference Benchmarks):
| Channel / Strategy | Illustrative Reference ROAS |
|---|---|
| Google Shopping & Brand Search | 400% – 800% (4x – 8x) |
| Amazon Sponsored Products | 350% – 600% (3.5x – 6x) |
| Meta Retargeting & Dynamic Ads | 300% – 500% (3x – 5x) |
| Paid Social Cold Prospecting | 180% – 280% (1.8x – 2.8x) |
| Top-of-Funnel Display & Video | 100% – 160% (1x – 1.6x) |
How to Use the Ad Spend Calculator
Choose Budgeting Mode
Select your planning method: forecast required spend by Revenue & ROAS, Conversions & CPA, or Traffic & CPC targets.
Input Campaign Targets
Enter your financial goals, primary channel, and industry. Alternatively, use the Multi-Channel tab to aggregate budgets across platforms.
Review & Share Projections
Examine required monthly spend, recommended daily pacing, and revenue after ad spend. Copy the full report or share the scenario via URL.
Want to Maximize Your Ad Spend ROI?
Review your campaign pacing, target bidding strategies, negative keyword exclusions, and landing page conversion rates with our PPC specialists.
Why Use This Ad Spend Calculator?
Designed for media buyers, founders, and performance marketers needing accurate ad budget planning, daily pacing projections, and multi-channel media aggregation.
| Capability | Our Tool | Basic Tools |
|---|---|---|
| Planning Methodologies | 3 Mathematical Modes | 1 Static Formula |
| Average Daily Pacing Projections | Real-time calculation | Manual math |
| Multi-Channel Aggregation | Dynamic channel rows | None |
| Scenario Sharing | 1-Click URL copy (full state) | Manual re-entry |
| Industry Reference Baselines | 15 Categories modeled | None |
Mastering Paid Ad Spend Allocation
Determining your advertising budget is one of the most critical decisions in performance marketing. Spending too little can limit automated smart bidding algorithms from acquiring sufficient conversion data, while over-allocating budget without prudent cost-per-acquisition (CPA) guardrails risks rapid capital depletion.
A sound ad spend strategy combines bottom-up unit economics with top-down revenue planning. By determining your allowable customer acquisition cost and expected average order value, you can reverse-engineer an ad spend budget that supports sustainable growth as you scale.
Key Pillars of Ad Budget Planning
- Budget Allocation Guidelines: As a popular planning framework, many performance marketers model an approximate 70-20-10 distribution: allocating roughly 70% of spend to proven core conversion channels (e.g. Google Search & Shopping), 20% to promising growth channels (e.g. Meta Advantage+ or TikTok Retargeting), and 10% to experimental formats. These proportions should serve as directional guidelines tailored to your product margins and business maturity.
- Algorithm Data Volume: Smart bidding algorithms on platforms such as Google Ads and Meta Ads often benefit from sustained conversion volume (frequently referenced in industry documentation as roughly 30 to 50 conversions monthly per campaign) to optimize efficiently, though actual data requirements vary based on bidding model, audience breadth, and conversion lag.
- Pacing and Diminishing Returns: Media costs do not always scale linearly. Beyond a certain threshold, ad frequency increases and marginal CPA can climb. Monitor marginal ROAS to detect when additional ad spend produces diminishing returns.
Our Digital Marketing Services
Professional growth services to optimize ad spend, boost rankings, and scale conversions.
Frequently Asked Ad Spend Questions
1. How do I calculate my required ad spend?
2. How much should a small business spend on advertising?
3. What is the difference between ad spend and total marketing budget?
4. How does average daily pacing work?
5. What is Blended Ad Spend and Blended ROAS?
6. How do I know if my ad spend is profitable?
7. What happens if my ad spend budget is set too low?
8. Does changing currency convert my numerical values?
9. What is diminishing return on ad spend?
10. How can I lower required ad spend while keeping revenue targets?
Need a Specific Tool? Or Found an Issue?
We continually update this calculator with helpful media planning tools and channel options.
Submit Request