
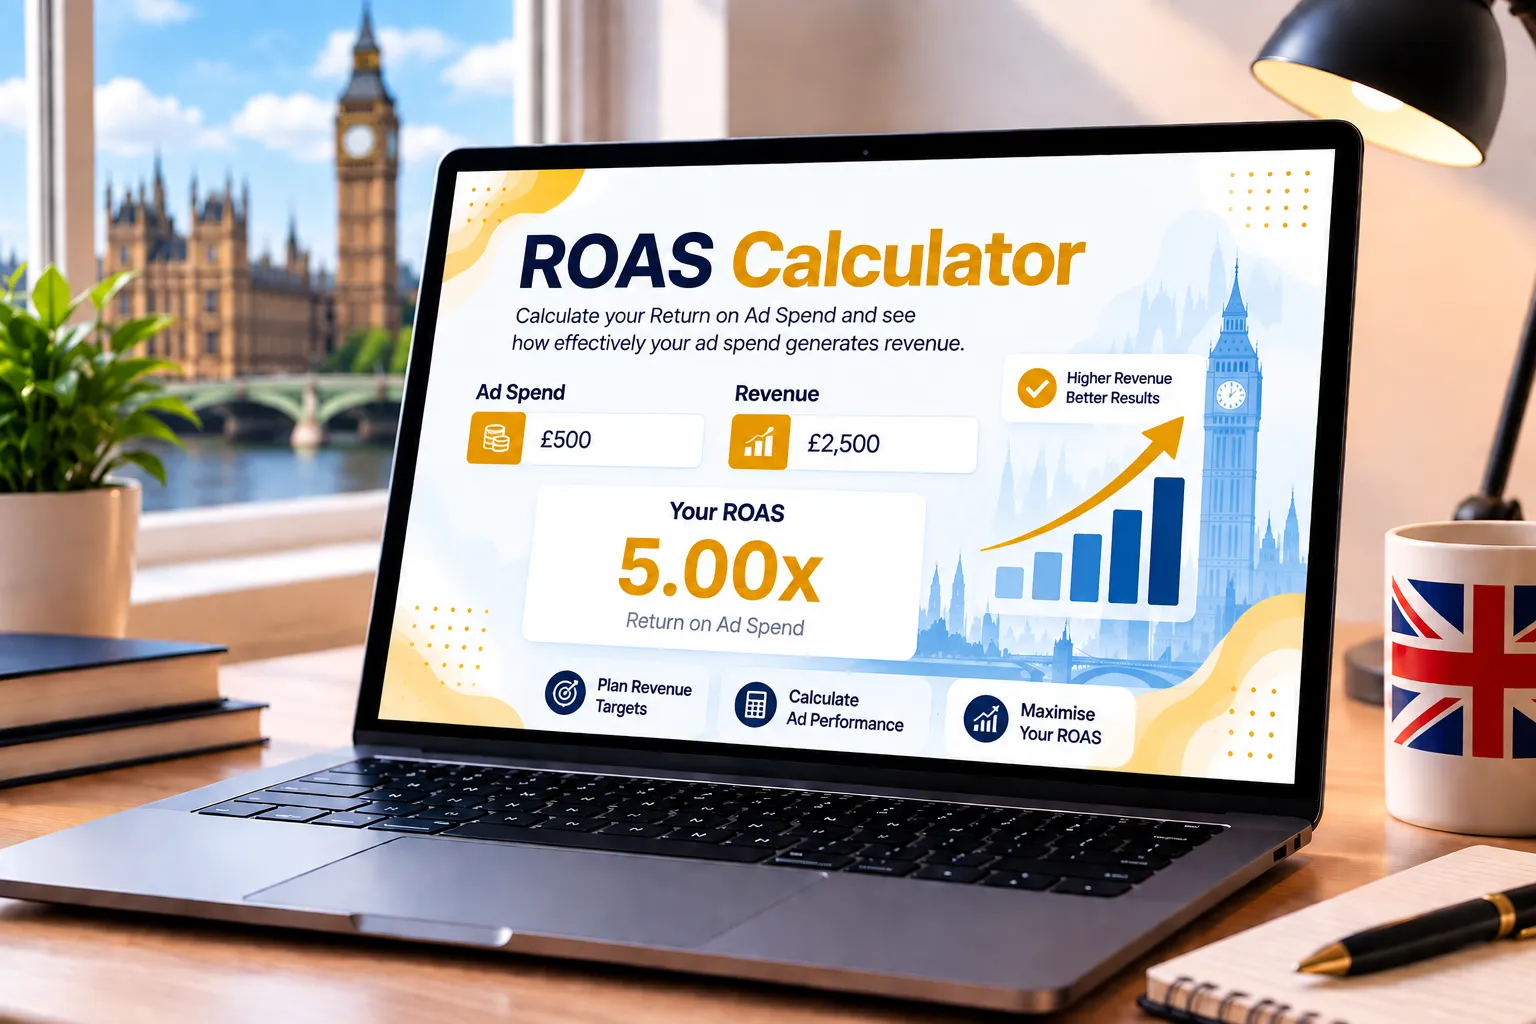
Return on Ad Spend (ROAS) Calculator
Calculate your campaign Return on Ad Spend, project required budget or revenue targets, and benchmark advertising revenue efficiency across major paid search, social, and marketplace channels.
400.00%
- Strong revenue efficiency and healthy campaign returns.
- Audit product margins and fulfillment costs to ensure net profitability.
Add KashifDigitals as a Preferred Source
Stay updated with verified paid media ROAS benchmarks, bidding strategies, and PPC revenue optimization guides.
Was This ROAS Calculator Useful?
Your quick feedback helps us enhance the calculator experience and financial modeling tools.
How ROAS is Calculated
Return on Ad Spend (ROAS) calculates gross revenue generated for every pound, dollar, or currency unit invested into paid advertising. It evaluates campaign efficiency, scaling thresholds, and ad profitability.
Primary Formulas
Core Formulas in Action
- Example: 10,000 revenue generated from 2,500 spend = (10,000 ÷ 2,500) = 4.00x or 400% ROAS.
- Net Ad Profit: 10,000 − 2,500 = 7,500 gross profit before product margins & overheads.
- Revenue per Currency Unit Spent: 10,000 ÷ 2,500 = 4.00 earned for every single unit spent.
- Multi-Channel Blended: (Sum of all Channel Revenue ÷ Sum of all Channel Spend) × 100
Illustrative Reference ROAS Ranges
Baseline planning ranges across differing media channels & formats (Source: KashifDigitals Aggregated PPC Dataset):
| Channel / Strategy | Illustrative Reference ROAS |
|---|---|
| Google Shopping / Brand Search | 400% – 800% (4x – 8x) |
| Meta Retargeting & Dynamic Ads | 300% – 500% (3x – 5x) |
| Amazon Sponsored Products | 350% – 600% (3.5x – 6x) |
| Paid Social Cold Prospecting | 180% – 280% (1.8x – 2.8x) |
| Display & Top-of-Funnel Video | 100% – 160% (1x – 1.6x) |
How to Use the ROAS Calculator
Select Mode & Currency
Choose your display currency and whether to calculate actual ROAS, model projected revenue from planned ad spend, or calculate required ad budget.
Enter Financials
Input your ad spend and revenue for a single campaign, or switch to Blended mode to aggregate multi-channel ad budgets.
Analyze & Share
Compare against illustrative reference benchmarks, evaluate target variances, copy a summary report, or share scenarios via URL.
Want to Scale Your Ad Revenue Profitably?
Review your target ROAS bidding, feed quality, negative keywords, and landing page conversions with our PPC specialists.
Why Use This ROAS Calculator?
Built for media buyers, e-commerce managers, and performance directors needing fast revenue modeling, multi-channel aggregation, and shareable performance projections.
Understanding ROAS in Digital Advertising
Return on Ad Spend (ROAS) is the primary financial yardstick for paid advertising campaigns. While metrics like CTR and CPC evaluate engagement efficiency, ROAS measures commercial viability by comparing revenue collected directly against advertising investment.
In automated bidding environments like Google Smart Bidding and Meta Advantage+ campaigns, setting a Target ROAS (tROAS) informs the auction algorithm to prioritize high-value cart abandoners and users likely to purchase larger average order values (AOV).
ROAS vs. ROI vs. Break-Even ROAS
- Break-Even ROAS: Determined by your gross profit margin (1 ÷ Profit Margin). If your gross profit margin is 25%, your break-even ROAS is 400% (4x). Any campaign generating less than 4x loses money when factoring in product cost of goods sold (COGS).
- ROAS vs ROI: ROAS only compares ad spend with gross revenue. Return on Investment (ROI) factors in all operational expenses, including inventory cost, shipping, payment processing fees, and overheads.
- Target ROAS (tROAS) Calibration: Setting your target ROAS too high can constrain campaign delivery by starving the algorithm of auction opportunities. Setting it too low can result in rapid ad spend at unviable profit margins.
Our Digital Marketing Services
Professional growth services to optimize ad spend, boost rankings, and scale conversions.
Frequently Asked ROAS Questions
1. What is Return on Ad Spend (ROAS)?
2. What is considered a "good" ROAS?
3. How do I calculate Break-Even ROAS?
4. What are the 3 planning modes in this calculator?
5. What is Blended ROAS (Marketing Efficiency Ratio - MER)?
6. How does ROAS differ from ROI?
7. What is Target ROAS (tROAS) bidding?
8. Why does Blended mode hide the single-channel benchmark?
9. Does changing currency convert my values?
10. What factors most significantly increase ad ROAS?
Need a Specific Tool? Or Found an Issue?
We continually update this calculator with helpful media planning tools and channel options.
Submit Request