
Quality Score Calculator
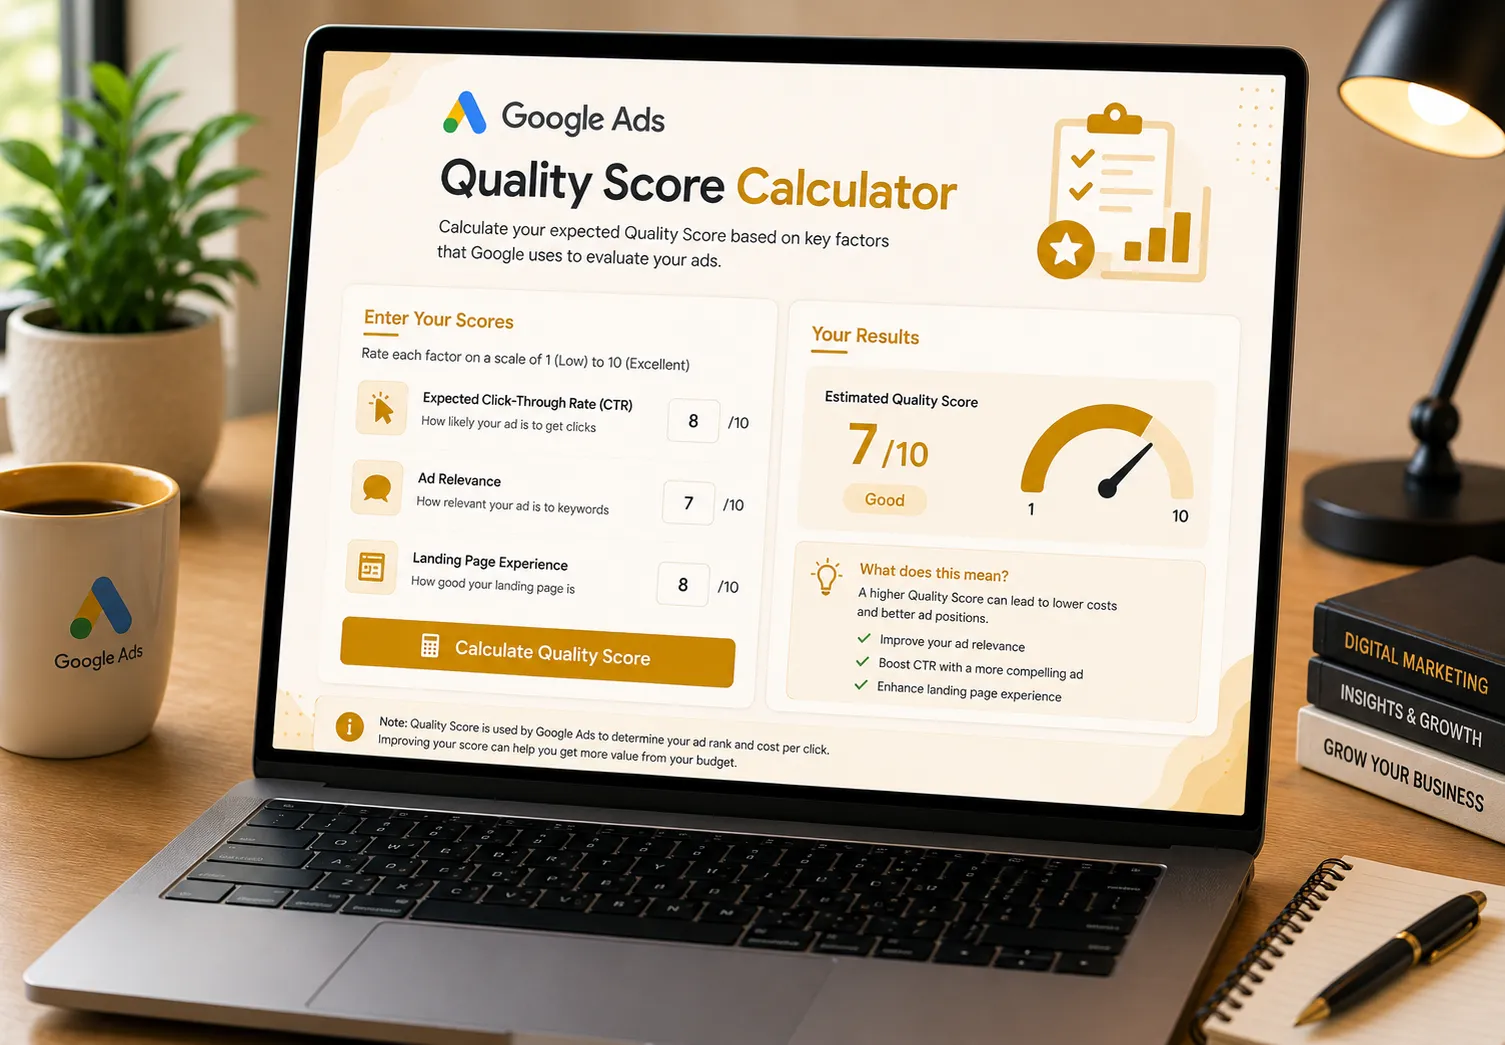
Forecast your Google Ads Quality Score instantly. Select the performance levels of your three core ad components below to see your estimated score on the 1-10 scale and find out where to optimize.
Enter Your Scores
Rate each factor on a scale of 1 (Low) to 10 (Excellent)
6
- Identify your 'Below Average' components to boost your score.
- All components are performing at average capacity.
How Quality Score Works
Google Ads calculates Quality Score (from 1 to 10) by combining a base score with the weighted performance of three factors. Expected CTR and Landing Page Experience carry the heaviest weight (roughly 39% each), while Ad Relevance carries the remaining weight (22%).
The Standard QS Point System
Exp. CTR = Up to 3.5 Points
Landing Page = Up to 3.5 Points
Ad Relevance = Up to 2 Points
Example Calculation
- Exp. CTR: Average (+1.75 Pts)
- Ad Relevance: Above Average (+2.0 Pts)
- Landing Page: Average (+1.75 Pts)
Why Quality Score Matters
Your Quality Score directly dictates how much you pay per click. A higher Quality Score means Google will charge you less to rank in top positions compared to competitors with lower scores.
| Quality Score | Cost Impact |
|---|---|
| 1/10 to 3/10 | Paying up to 400% more per click |
| 4/10 to 6/10 | Paying slightly above or average CPC |
| 7/10 | The Benchmark (No discount or penalty) |
| 8/10 to 10/10 | Receiving CPC discounts (Up to 50% off) |
How to Use the Quality Score Calculator
Input Expected CTR
Select whether your Expected Click-Through Rate is Below Average, Average, or Above Average as shown in your Google Ads account.
Input Ad Relevance
Select the status of your Ad Relevance. This measures how closely your keyword matches the message in your ads.
Input Landing Page
Select your Landing Page Experience status, which grades your page speed, keyword relevance, and mobile usability.
Mastering Your Google Ads Quality Score
In Google Ads, the highest bidder doesn't always win the top position. Google uses a metric called Quality Score to ensure users are shown highly relevant, useful ads rather than just ads from the advertiser with the deepest pockets. Your Ad Rank is calculated by multiplying your Max CPC Bid by your Quality Score. Therefore, a high Quality Score is a cheat code to outranking competitors while actually paying a lower Cost Per Click (CPC).
Quality Score is evaluated on a scale of 1 to 10 and is made up of three primary components: Expected Click-Through Rate (CTR), Ad Relevance, and Landing Page Experience. Each component is graded as 'Below Average', 'Average', or 'Above Average'. When all three elements are marked 'Average', your score typically hovers around a 6/10. Securing 'Above Average' marks adds crucial points to your score, pushing you towards the coveted 9/10 or 10/10 tier where click discounts apply.
If your Quality Score is low (1 to 4), you are likely paying a heavy penalty on your CPCs. Using our Quality Score calculator, you can instantly see the mathematical impact of improving just one component. For example, if your Expected CTR is 'Below Average', rewriting your ad copy to be more compelling could bump it to 'Average', instantly lifting your overall Quality Score and dropping your ad costs.
Frequently Asked Questions (Quality Score)
1. Where do I find my Quality Score in Google Ads?
2. What is a "Good" Quality Score?
3. Which component has the biggest impact on Quality Score?
4. How do I fix a 'Below Average' Ad Relevance?
5. Why is my Landing Page Experience 'Below Average'?
6. Does Quality Score matter for Performance Max or Display ads?
7. Why do I have a dash (-) instead of a Quality Score?
8. Should I pause keywords with a Quality Score of 3?
More PPC Calculators
Client Success Stories & Reviews
"This Quality Score calculator is brilliant for visualizing Google's grading system. It helped me realize that fixing my 'Below Average' CTR would bump me from a 4 to a 7 almost instantly."
"I use this to show clients exactly why we need to rewrite their landing pages. Plugging in the metrics and watching the estimated score change makes the conversation so much easier."
"Such a handy diagnostic tool. I didn't realize Ad Relevance had a slightly lower weight than Landing Page Experience until I played around with these inputs. Great learning tool."
"Google's 1-10 score always felt like a mystery box. This calculator finally breaks down the math behind it so I know exactly which levers to pull to drop my CPCs."
"We were paying a massive premium for our top keywords. By targeting the 'Below Average' components highlighted here, we pushed our QS to 8/10 and saw our CPC drop by 30%."
"Simple and effective. The yellow dropdown design is incredibly clean, and the math matches exactly what we see in our live Google Ads accounts."
Need a Specific Tool? Or Found a Bug?
Our dev team is actively updating this page with useful new calculators. If you have an idea for a business tool or want to report a calculation error, please let us know.
Submit Request / Report Bug